Overview
The Geo Analytics section provides comprehensive geographic insights into your search traffic and user behavior patterns across different countries and regions. For information about filtering options, see Overview - Filter Options. This powerful visualization tool helps you understand global market reach, identify expansion opportunities, and optimize your search experience for different geographic markets. Geographic data is essential for strategic business decisions, marketing campaigns, and regional optimization efforts.
Why Use Geo Analytics?
Geographic analytics enable data-driven international business strategies:
- Market Intelligence - Understand where your customers are searching from
- Regional Performance - Compare search behavior across different countries
- Expansion Planning - Identify high-potential markets for growth
- Localization Strategy - Adapt search experience for regional preferences using Profile Settings
- Marketing Optimization - Target campaigns based on geographic insights
- Resource Allocation - Prioritize markets based on search activity
Business Impact:
Geographic insights help optimize global reach, improve regional user experience, and make informed decisions about market expansion and localization investments. Configure User Management access for global teams and set up Notifications for geographic performance alerts.
Key Interface Components
Component
Features & Description
Date Range and Filtering Controls
• Date Range Selector: Custom period selection
• Clear Date Range: Reset date filters
• Filter Options: Advanced filtering capabilities
• Comparison Mode: Compare different time periods
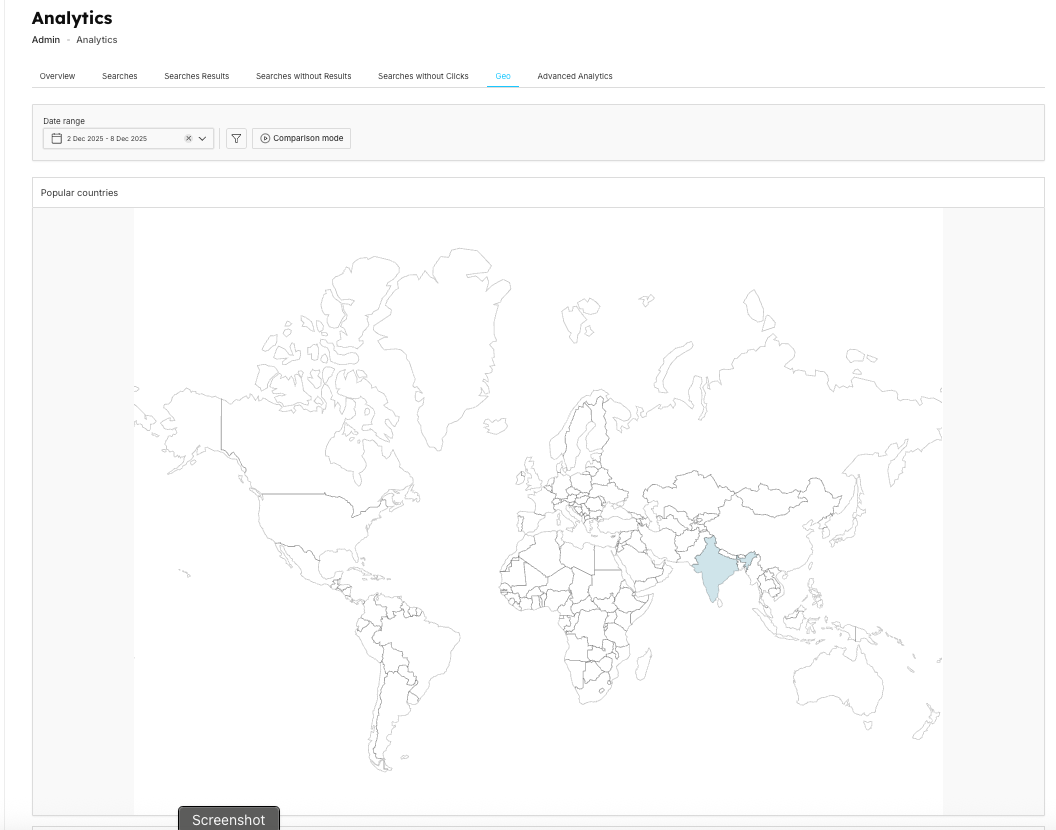
Interactive World Map Visualization
Visual Representation:
• Country Shading: Different intensities indicate search volume levels
• Color Coding: Darker shades represent higher search activity
• Interactive Regions: Click on countries for detailed analysis
• Global Overview: Complete world coverage with activity indicators
Key Visual Elements:
• High Activity Regions: Prominently highlighted countries (e.g., India in dark teal)
• Medium Activity: Lighter blue shading for moderate search volumes
• Low/No Activity: White or very light regions with minimal search traffic
• Hover Details: Country-specific metrics on mouse interaction
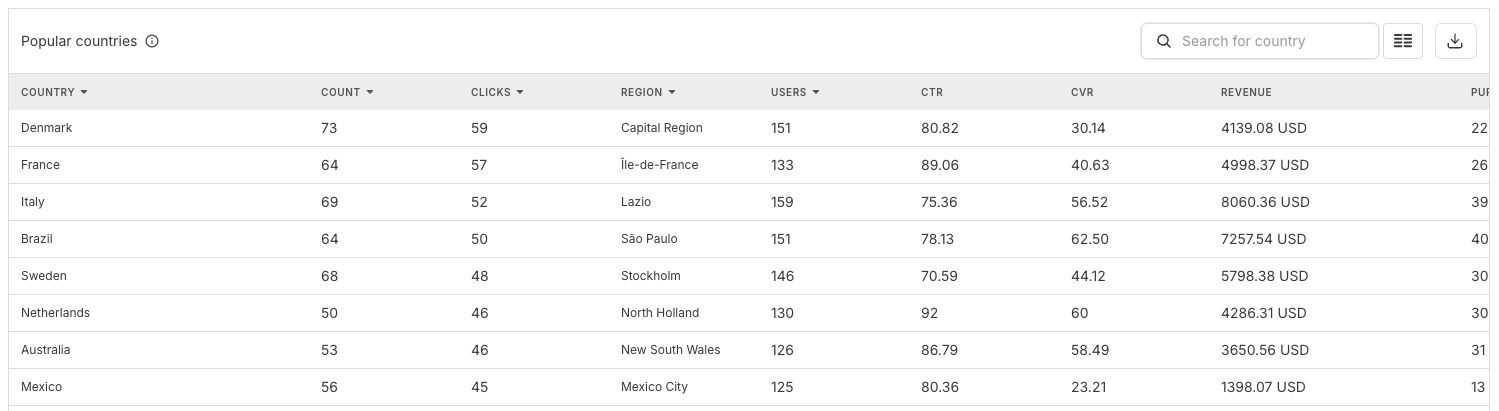
Popular Countries Analysis Table
Comprehensive Data Columns:•
Country: Geographic location of search traffic
•
Count: Total number of searches from each country
•
Clicks: User engagement (clicks on search results)
•
Region: Specific regional breakdown within countries
•
Users: Number of unique users from each location
•
Click-through Rate (CTR): Engagement percentage (see
Searches without Clicks for low-engagement analysis)
•
CVR: Conversion rate (purchase completion percentage)
Sample Geographic Data:
Country
Count
Clicks
Region
Users
Click-through Rate
CVR
Denmark
5
8
Capital Region
20
160
20
France
7
4
Île-de-France
11
57.14
0
Germany
6
3
Bavaria
13
50
16.67
Mexico
5
2
Mexico City
11
40
20
Country Search
Find specific countries
Column Options
Customize table display
Export Data
Download geographic data
Country-Level Deep Dive Analysis
Detailed Country Analytics Modal
When clicking on specific countries (e.g., "Italy"), access detailed breakdowns:
Metric
Value & Description
Total Searches
Country-specific search volume
Click Performance
42.86% average click position
Conversion Metrics
35.33% conversion rate
Regional Distribution
Breakdown by states/provinces
Popular Query Analysis:
Query
Searches
Clicks
Click-through Rate
Popular Results Section:
No Data Indicators
Areas where additional insights needed
Result Performance
Product performance by geographic region
Search Result Rankings
Position analysis for country-specific searches
Popular Filter Analysis:
Analysis Type
User Filtering Behavior by Country
Filter Usage Patterns
How users narrow search results
Category Preferences
Popular product categories by region
Performance Impact
How filters affect search success rates
European Market Analysis
Based on sample data showing strong European presence:
Region
Performance Metrics
Nordic Countries
Denmark (160 Click-through Rate), Finland (80 Click-through Rate), Norway (100 Click-through Rate)
Western Europe
Belgium (30 Click-through Rate), Germany (50 Click-through Rate), France (57.14 Click-through Rate)
Southern Europe
Italy (42.86 Click-through Rate), Spain (60 Click-through Rate)
Insight Category
Key Findings
Engagement Variation
Click-through Rate ranges from 30% (Belgium) to 160% (Denmark)
Conversion Patterns
Spain leads with 40% CVR, Italy at 14.29%
User Distribution
Consistent user bases across major markets
Regional Preferences
Different search and engagement patterns
Global Market Opportunities
Market Category
Opportunity Description
Established Markets
Strong European presence with high engagement
Emerging Markets
Mexico showing promising 20% CVR
Expansion Potential
Countries with users but low engagement
Optimization Targets
High search volume with low conversion rates
Geographic Insights and Patterns
Search Volume Distribution
High Volume Markets:
Market Segment
Performance Details
Countries with 7+ searches
France, Italy (both 7 searches)
Consistent engagement
Belgium (10 searches), indicating strong market presence
Regional leaders
Denmark, Finland, Spain (5 searches each)
Engagement Quality:
Engagement Type
Performance Analysis
Premium Engagement
Denmark (160 Click-through Rate) suggests high user intent
Balanced Performance
Norway (100 Click-through Rate, 0 CVR) indicates engagement without conversion
Conversion Leaders
Spain (40 CVR) and Germany (16.67 CVR)
Regional Behavioral Patterns
Search Behavior Analysis:
Behavioral Factor
Regional Pattern
European Focus
Strong concentration in Western and Northern Europe
Urban Centers
Activity concentrated in major metropolitan areas
Language Considerations
Performance varies by linguistic regions
Cultural Factors
Different engagement patterns suggest local preferences
Market Maturity Indicators
Mature Markets:
Market Characteristic
Description
Search Volume & Conversion
High search volumes with stable conversion rates
User Engagement
Consistent user engagement across time periods
Geographic Distribution
Regional distribution within countries
Search Patterns
Established search patterns and preferences
Emerging Markets:
Market Characteristic
Development Opportunity
Search Volume Growth
Growing search volumes with optimization potential
Engagement Patterns
Variable engagement rates suggesting market development stage
Activity Concentration
Concentrated activity in major cities/regions
Market Development
Opportunity for localization and market development
Strategic Business Applications
Market Expansion Planning
Priority Market Identification:
Market Tier
Characteristics
Examples
Tier 1 Markets
High volume + high conversion
Spain, Germany
Tier 2 Markets
High volume + optimization potential
France, Italy
Tier 3 Markets
Emerging opportunities
Mexico, other growing markets
Investment Allocation:
Investment Area
Strategy & Focus
Marketing Spend
Prioritize based on Click-through Rate and CVR performance
Localization Efforts
Focus on high-user-count, low-engagement markets
Infrastructure
Scale resources for high-volume regions
Customer Support
Language and timezone considerations
Localization Strategy
Content Adaptation:
Adaptation Area
Implementation Strategy
Language Optimization
Tailor search experience for local languages
Cultural Relevance
Adapt product presentation for regional preferences
Currency Integration
Local pricing and payment options
Seasonal Adjustments
Regional seasonal patterns and holidays
Technical Optimization:
Technical Area
Optimization Strategy
Server Location
CDN optimization for geographic performance
Search Algorithms
Regional preference learning and adaptation
Mobile Optimization
Device preference patterns by region
Loading Performance
Regional infrastructure considerations
Marketing Campaign Optimization
Geographic Targeting:
Targeting Strategy
Implementation Approach
High-Performance Regions
Increase investment in proven markets
Opportunity Markets
Targeted campaigns for high-potential, low-engagement areas
Seasonal Campaigns
Regional timing and seasonal preferences
Cultural Marketing
Localized messaging and cultural adaptation
Budget Allocation:
Budget Strategy
Allocation Approach
ROI-Based Distribution
Allocate based on conversion performance
Growth Investment
Fund expansion in emerging high-potential markets
Retention Focus
Maintain presence in established high-performing regions
Testing Markets
Small investments in new geographic opportunities
Metric Category
Key Indicators
Primary Metrics
• Geographic Coverage: Number of countries with active users
• Regional Performance: Click-through Rate and CVR by geographic region
• Market Penetration: User growth in target markets
• Revenue Distribution: Geographic contribution to total revenue
Quality Metrics
• Engagement Consistency: Stable performance across regions
• Conversion Efficiency: Revenue per user by geography
• Search Success: Result relevance for regional queries
• User Satisfaction: Regional retention and repeat usage rates
Optimization Workflows
Daily Monitoring
• Performance Alerts: Significant changes in regional metrics
• Traffic Spikes: Unusual geographic activity patterns
• Conversion Tracking: Regional revenue and conversion monitoring
• User Experience: Regional performance and error monitoring
Weekly Analysis
• Trend Identification: Emerging patterns in geographic performance
• Competitive Analysis: Regional market share and positioning
• Campaign Performance: Geographic campaign effectiveness
• Resource Planning: Regional infrastructure and support needs
Monthly Strategic Review:
Review Area
Strategic Focus
Market Assessment
Comprehensive regional performance evaluation
Expansion Planning
New market opportunity identification
Investment Review
ROI analysis for geographic investments
Localization Progress
Regional adaptation effectiveness
Regional Optimization Strategies
Strategy Focus
Implementation
Scale Success
Increase investment and resources
Maintain Quality
Ensure consistent performance standards
Expand Offerings
Introduce new products/services
Deepen Engagement
Enhanced localization and personalization
Strategy Focus
Implementation
Root Cause Analysis
Identify performance barriers
Targeted Improvements
Specific interventions for key issues
A/B Testing
Validate optimization strategies
Gradual Investment
Measured approach to improvement efforts
Integration with Business Operations
Product Management
Regional Demand
Geographic patterns inform inventory decisions
Market Adaptation
Product mix optimization for regional preferences
Pricing Strategy
Geographic pricing and competitive positioning
Launch Planning
Regional rollout strategies for new products
Customer Success
Monitor geographic optimization changes via Activity Logs to track effectiveness of regional strategies.
Support Optimization
Regional support team allocation
Language Services
Multi-language customer service priorities
Response Times
Regional service level agreements
Cultural Training
Regional customer service best practices
Technical Operations
Ensure proper team access control via Roles & User Management for geographic analytics management.
Technical Area
Implementation
Infrastructure Scaling
Regional server and CDN optimization
Performance Monitoring
Geographic performance tracking
Compliance Management
Regional regulatory and legal compliance
Security Considerations
Regional security and privacy requirements
Advanced Analytics and Insights
Analytics Type
Capabilities
Predictive Geographic Analytics
• Market Growth Forecasting: Predict regional expansion opportunities
• Seasonal Modeling: Geographic seasonal pattern analysis
• Competitive Intelligence: Regional market share evolution
• User Behavior Prediction: Geographic user journey modeling
Cross-Regional Analysis
• Performance Benchmarking: Compare similar markets and regions
• Best Practice Identification: Learn from high-performing regions
• Resource Optimization: Balance resource allocation across regions
• Risk Assessment: Geographic risk and opportunity analysis
Integration Analytics
• Multi-Channel Correlation: Geographic performance across channels
• Customer Lifetime Value: Regional CLV analysis and optimization
• Attribution Modeling: Geographic contribution to overall performance
• Cohort Analysis: Regional user retention and engagement patterns
Notes
📌 Important:
- Geographic data enables strategic international business decisions
- Regional performance variations require localized approaches
- Privacy regulations vary by geography and must be considered
- Cultural factors significantly impact user behavior and preferences
- Regular monitoring prevents missing emerging market opportunities
Frequently Asked Questions
How do I identify the best markets for expansion?
Look for markets with high user counts but low engagement rates - these represent optimization opportunities. Also consider markets with growing search volumes and favorable competitive landscapes. Use the Interactive World Map Visualization for visual analysis of market opportunities.
Core Analytics
Management & Configuration