Overview
The Searches without Results analytics tracks search queries that returned zero results from your product catalog. For information about filtering options, see Overview - Filter Options. This critical data helps identify gaps in your inventory, search configuration issues, and missed business opportunities. Understanding what customers are searching for but not finding is essential for strategic business decisions and search optimization.
Why Monitor Searches without Results?
Zero-result searches represent direct indicators of potential business opportunities and system issues:
-
Missing Products - Customers want items not in your catalog
-
Search Configuration Problems - Technical issues preventing matches
-
Inventory Gaps - Out-of-stock or discontinued popular items
-
Misspelling Issues - Common variations not handled properly
-
Category Misalignment - Products exist but aren't findable
-
Tracking Changes - Monitor optimization impact via Activity Logs - Search Analytics
Business Impact:
Every zero-result search is a lost sales opportunity. These searches often indicate high commercial intent - customers know what they want but can't find it in your store. Set up Notifications to get notified when zero-result rates spike.
Key Metrics and Interface Components
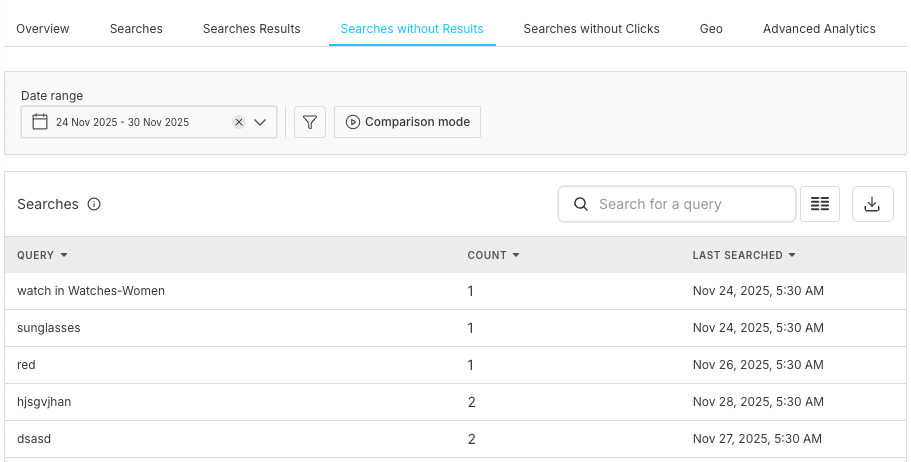
1. Search Query Analysis Table
Core Columns
• Query: The actual search terms users entered
• Searches: Number of times the query was searched
• Last Searched: Most recent occurrence of the search
Sample Data Insights
• zipper - 1 search, Last: Oct 29, 2025, 1:51 PM
• yoga mat - 66 searches, Last: Nov 24, 2025, 5:05 AM
• Yellow coke- 5 search, Last: Dec 1, 2025, 4:37 PM
Search Volume
Total number of searches without clicks
Query Frequency
How often specific terms are searched
Time Patterns
When searches occur most frequently
Recency Data
Latest occurrence of each query
3. Search Analysis Table
Query
The exact search terms that returned no results
Count
Number of times each query was searched
Last Searched
Most recent occurrence of the search
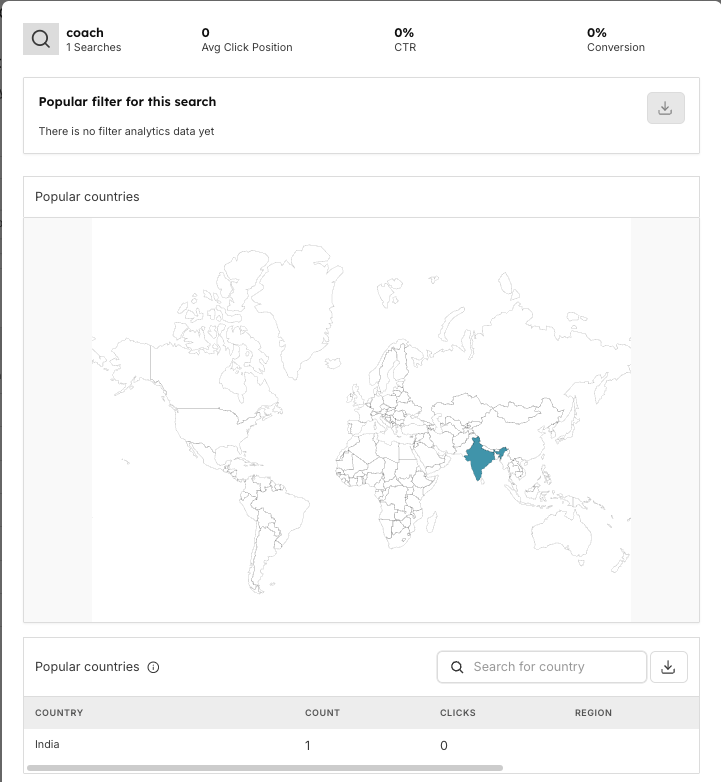
Detailed Query Analysis Modal
Search Performance Overview
When clicking on a specific zero-result query (e.g., "winter coat"):
Key Metrics Display:
• Total Searches: 0 searches in selected period
• Average Click Position: 37.50% (indicates some results were shown)
• Click-through Rate: 0% (no clicks occurred)
• Conversion: 0% (no purchases)
Popular Filter Analysis
Visual breakdown showing search attempt patterns:
• Purple Bars: Historical search attempts
• Green Bars: Comparative periods or successful results
• Category Breakdown: Shows which categories were searched
• Filter Usage: How users attempted to narrow results
Geographic Distribution
World Map Visualization:
• Interactive Map: Visual representation of search origins
• Country Highlighting: Regions with search activity
• Density Indicators: Search volume by geographic area
Country-Level Analytics {#country-analytics} Table:
Netherlands
2
0
North Holland
Australia
1
0
New South Wales
Regional Insights:
Search Distribution
Global reach of zero-result queries
Regional Patterns
Local preferences and needs
Market Opportunities
Geographic expansion possibilities
Pagination
Browse through extensive country data (50+ per page)
Category-Specific Searches
Characteristics
Searches within specific categories that fail
Examples
"watch in Watches-Women" (category-specific search)
Common Causes
• Products exist but in different categories
• Category filters too restrictive
• Cross-category product placement issues
• Navigation structure problems
Optimization Actions
• Review category organization
• Implement cross-category search
• Add product to multiple relevant categories
• Improve category labeling and descriptions
Seasonal and Trending Searches
Characteristics
Time-sensitive searches for seasonal items
Examples
"yoga mat" (fitness trends), "winter coat" (seasonal)
Analysis Factors
• Seasonal demand patterns
• Trending product categories
• Inventory planning cycles
• Competitive landscape analysis
Strategic Planning
• Forecast seasonal demands
• Plan inventory acquisition timelines
• Create pre-season marketing campaigns
• Develop vendor relationships for trending items
Regional Market Gaps
Characteristics
Searches concentrated in specific geographic regions
Market Intelligence
• Local preferences and needs
• Regional product availability
• Cultural and seasonal factors
• Competitive landscape by region
Expansion Opportunities
• Target regional inventory expansion
• Localized marketing campaigns
• Regional vendor partnerships
• Currency and shipping considerations
Search Configuration Analysis
Issue Category
Technical Root Causes
Optimization Steps
Indexing Issues
• Missing Attributes: Products not searchable by relevant terms
• Index Configuration: Searchable fields not properly configured
• Data Sync Problems: Products exist but not indexed for search
• Attribute Mapping: Product data not mapped to searchable fields
• Review Searchable Attributes: Ensure all relevant fields are searchable
• Verify Index Status: Ensure all products are properly indexed
• Check attribute mapping configuration
Search Algorithm Problems
• Typo Tolerance: Misspellings not handled properly
• Synonym Management: Alternative terms not recognized
• Stop Words: Important terms incorrectly filtered out
• Search Scope: Searches limited to wrong product fields
Product Data Quality
• Missing Information: Products lack searchable descriptions
• Inconsistent Naming: Product titles don't match search terms
• Category Misalignment: Products in unexpected categories
• Metadata Gaps: Missing tags, attributes, or classifications
• Add Semantic Search: Understand intent beyond exact matches
• Configure Faceted Search: Allow refinement instead of zero results
• Implement Auto-Complete with
Query Suggestions
Business Intelligence and Opportunities
Intelligence Category
Key Analysis Areas
Market Demand Analysis
• Product Gap Identification: What customers want but can't find
• Trend Detection: Emerging product categories and demands
• Seasonal Planning: Inventory timing for seasonal searches
• Competitive Analysis: Compare gaps with competitor offerings
Revenue Impact Assessment
• Lost Sales Calculation: Estimate revenue from zero-result searches
• Customer Lifetime Value: Impact of search frustration on retention
• Market Share: Opportunities captured by competitors
• ROI Analysis: Investment return for addressing top zero-result queries
Strategic Planning Integration
• Product Development: New product line opportunities
• Vendor Negotiations: Data-driven sourcing decisions
• Marketing Strategy: Content and campaign opportunities
• Technology Investment: Search improvement prioritization
Optimization Workflows
Combine zero-result insights with overall search performance data for comprehensive optimization strategies.
Immediate Response
(Daily)
1. Monitor High-Volume Queries: Check for sudden spikes in zero results
2. Quick Product Additions: Add obviously missing popular items
3. Configuration Fixes: Address clear technical issues
4. Customer Communication: Acknowledge awareness of missing items
Weekly Analysis
1.
Trend Identification: Analyze patterns in zero-result searches
2.
Geographic Review: Check regional variations and opportunities
3.
Category Analysis: Identify systematic gaps in product categories
4.
Performance Tracking: Monitor improvement from previous changes (see
Performance Monitoring)
Monthly Strategic Review
1. Comprehensive Gap Analysis: Full inventory vs demand assessment
2. Vendor Planning: Source products for consistent zero-result queries
3. Search Optimization: Major configuration improvements
4. Business Case Development: ROI analysis for product additions
Quarterly Planning
1. Market Expansion: Geographic and category expansion strategies
2. Technology Upgrades: Search algorithm and feature improvements
3. Competitive Analysis: Benchmark against industry standards
4. Long-term Forecasting: Seasonal and trend-based planning
Metric Category
Key Performance Indicators
Primary Metrics
• Zero Result Rate: Percentage of searches returning no results
• Query Resolution Time: How quickly zero-result issues are addressed
• Geographic Coverage: Percentage of regions with product availability
• Seasonal Preparedness: Inventory readiness for predictable searches
Success Indicators
• Decreasing Zero Results: Month-over-month improvement
• Improved Conversion: Better results leading to more purchases
• Regional Expansion: Reduced geographic gaps in product availability
• Customer Satisfaction: Reduced complaints about missing products
Alert Thresholds
• Spike Detection: Unusual increases in zero-result searches
• New Query Patterns: Emergence of new high-volume zero-result terms
• Regional Concentration: Geographic clustering of specific searches
• Seasonal Preparedness: Early warning for seasonal demand gaps
Integration with Business Operations
Team
Integration Areas & Responsibilities
Product Management
• Inventory Planning: Data-driven product sourcing decisions
• Category Management: Product placement optimization
• Vendor Relations: Negotiation leverage with suppliers
• Pricing Strategy: Demand validation for pricing decisions
Marketing Teams
• Content Strategy: Address search gaps with informational content
• Campaign Planning: Target high-demand but unavailable products
• SEO Opportunities: Content for searched but missing products
• Customer Communication: Manage expectations for missing items
Technical Teams
• Search Optimization: Algorithm and configuration improvements
• Data Quality: Product information enhancement
• Performance Monitoring: Search system health tracking
• Integration Development: Connect search data with business systems
Best Practices and Recommendations
Practice Category
Best Practices & Guidelines
Data Collection
• Comprehensive Tracking: Capture all zero-result searches
• Clean Data Sets: Filter out bot traffic and test searches
• Historical Preservation: Maintain trend analysis capabilities
• Real-time Monitoring: Immediate detection of new patterns
Analysis Methodology
• Segment Analysis: Break down by user type, device, region
• Cohort Studies: Track user behavior after zero results
• A/B Testing: Validate optimization effectiveness
• Competitive Benchmarking: Compare with industry standards
Action Prioritization
• Impact vs Effort Matrix: Balance quick wins with strategic investments
• Revenue Potential: Focus on high-commercial-intent searches
• Resource Allocation: Optimize team and budget utilization
• Timeline Management: Balance immediate fixes with long-term solutions
Optimization Strategies
Timeline
Strategy
Action Items
Immediate
Identify Top Problem Queries
• Focus on highest volume searches without clicks
• Prioritize recent and recurring searches
• Address zero-results queries first
Immediate
Quick Wins
• Fix obvious spelling variations
• Add missing popular products
• Improve product titles and descriptions
• Optimize product images
Short-Term
Search Improvements
• Enhance synonym dictionaries
• Improve typo tolerance
• Implement auto-complete suggestions
• Optimize ranking factors
Medium-Term
User Experience Enhancement
• Redesign search results layout
• Improve product information display
• Add comparison features
• Implement personalization
Long-Term
Predictive Analytics
• Forecast search trends
• Anticipate seasonal demands
• Identify emerging categories
• Plan inventory accordingly
Long-Term
Machine Learning Integration
• Implement AI-powered search
• Use behavioral learning
• Personalize search results
• Automate optimization
Notes
📌 Important:
- Zero-result searches often indicate high purchase intent
- Geographic patterns reveal market expansion opportunities
- Regular monitoring prevents accumulation of major gaps
- Integration with inventory systems enables proactive solutions
- Customer communication about missing items maintains trust
Frequently Asked Questions
What's an acceptable zero-result rate?
Industry benchmarks vary, but generally under 10-15% is good for e-commerce. The rate depends on catalog size, product diversity, and search sophistication.
How do I prioritize which missing products to add?
Focus on high-volume, recent searches with clear commercial intent. Consider profit margins, sourcing difficulty, and strategic fit with your brand.
Why do some regions show more zero-result searches?
Regional differences often reflect local preferences, seasonal variations, cultural factors, product availability, or different marketing presence.
How quickly should I respond to zero-result queries?
High-volume queries need immediate attention (24-48 hours). Lower-volume queries can be addressed in weekly or monthly cycles based on strategic importance.
How do I measure success in reducing zero results?
Track zero-result rate reduction, conversion improvement from previously zero-result queries, customer satisfaction scores, and revenue from newly added products.
Should I add all products that people search for?
No, consider brand fit, profit margins, sourcing feasibility, and strategic alignment. Some searches may be better addressed through partnerships or alternative solutions.
Core Analytics
Management & Monitoring
Billing & Usage Analytics