
SEARCHES

Overview

Searches provides detailed analytics for every search query performed on your platform. Analyze individual queries with metrics like search count, click-through rate, and conversion rate. Use this data to optimize search relevance and improve user experience.

For a broader view of your search analytics, see the Analytics Overview. To dive deeper into individual product performance, check Searches Results.


Comparison Mode

Searches Analytics

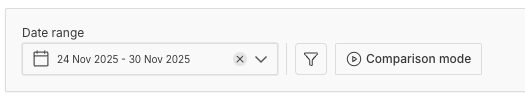
For detailed information about Comparison Mode functionality, see Overview - Comparison Mode.


Filter Options

Filter
Description
Available Options
Analytics Tags
Filter by search source or type
Placeholder: Select tags to filter metrics below
• back_to_school
• And other custom tags based on your configuration
Additional Tags
Secondary filtering for more precise analysis
Placeholder: Select tags to filter metrics below
• Custom tags and filters
• Campaign-specific tags
• User segment tags

View Options

Icon
Functionality
Column Toggle ()
• Show/hide table columns
• Customize view
Download ()
• Export search data
• Download as CSV or other formats

Searches Table

Table Columns

Search Table
Column
Description
Details
Use Cases
QUERY
The actual search term entered by users
Sortable: Click header to sort alphabetically
Examples: Product names, categories, general terms
• Identify popular search terms
• Spot spelling variations
• Find trending queries
SEARCHES
Number of times this query was searched
Sortable: Click header to sort by volume
Format: Numeric count
• Prioritize high-volume queries
• Track query popularity
• Identify demand patterns
CLICK-THROUGH RATE
Percentage of searches where users clicked on results
Sortable: Click header to sort by rate
Format: Percentage (e.g., 28.57%, 16.67%)
Calculation: (Clicks ÷ Searches) × 100
• Measure result relevance
• Identify queries needing optimization
• Validate search improvements
CVR (Conversion Rate)
Percentage of searches that led to desired action
Sortable: Click header to sort by conversion
Format: Percentage or numeric (e.g., 0, 0.00%)
Calculation: (Conversions ÷ Searches) × 100
• Measure business impact
• Identify high-value queries
• Optimize for revenue

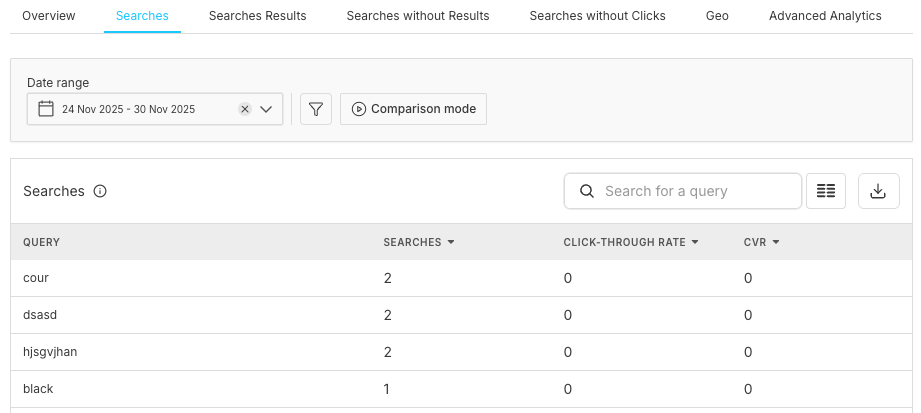
Column Interpretations:

Metric
Performance Interpretation
Click-through Rate
High Click-through Rate (greater than 30%): Good result relevance
Medium Click-through Rate (10-30%): Acceptable performance
Low Click-through Rate (less than 10%): Poor result quality
0% Click-through Rate: No clicks - results not relevant
Conversion Rate
Good CVR: Varies by industry (typically 2-10%)
0 CVR: No conversions recorded

Understanding the Data

Search Volume Analysis

Query Type
Characteristics
High-Volume Queries
• Most important for optimization
• Represent core user needs
• Impact largest number of users
Low-Volume Queries
• Long-tail searches
• Specific user needs
• May indicate niche opportunities

Click-Through Rate Patterns

Click-through Rate Pattern
Indicators
High Click-through Rate Queries
• Well-matched results
• Clear user intent
• Good ranking algorithm
Zero Click-through Rate Queries
• Results not relevant
• Poor result positioning
• Need immediate attention
• May also appear in Searches without Results
Mixed Click-through Rate
• Some users find results useful
• Room for improvement
• Consider A/B testing

Conversion Rate Analysis

Conversion Type
Indicators & Causes
Zero Conversions
• User didn't complete desired action
May indicate:
• Wrong products/content shown
• Pricing issues
• Checkout problems
• Informational searches (no purchase intent)
Positive Conversions
• Effective search-to-purchase flow
• Relevant results
• Good user experience

Working with Search Data

Identifying Optimization Opportunities

Step
Action
Details
Step 1
Sort by Searches
• Find high-volume queries
• Focus on queries with most impact
Step 2
Check Click-through Rate
• Low Click-through Rate + High Volume = Priority fix
• Improve result relevance
• Adjust ranking
Step 3
Review CVR
• High searches + Low CVR = Conversion issue
• Optimize landing pages
• Review pricing/offers

Using Filters

Filter Type
Steps
Purpose
Filter by Source
1. Select analytics tag
2. See Overview for complete list
3. Apply filter to data
• Compare performance across sources
• Optimize each channel separately
• Identify best performing traffic sources
Compare Time Periods
1. Enable comparison mode
2. Select two date ranges
3. View side-by-side data
• Identify trends and changes
• Validate improvements
• Track performance over time

Search Query Optimization

Query Issue
Optimization Steps
Expected Outcome
Low Click-through Rate Queries
1. Review actual results returned
2. Check if results match intent
3. Add synonyms or query rules
4. Improve ranking weights
5. Consider query suggestions
• Higher click-through rates
• Better result relevance
• Improved user satisfaction
• Increased engagement
Zero Conversion Queries
1. Verify products/content availability
2. Check result quality
3. Review landing page experience
4. Analyze pricing competitiveness
5. Consider merchandising rules
• Increased conversion rates
• Better business outcomes
• Enhanced user journey
• Higher revenue per search

Advanced Analysis

Click Position Analysis

Analysis Type
Available Metrics
Insights Gained
General Analysis
• Which results get clicked most
• Position of first click
• Scroll depth required
• Identify top-performing results
• Optimize result ranking
• Improve user experience
Modal View
(if available)
• Click on query row to open details
• View detailed metrics
• See click position heatmap
• Analyze popular results for query
• Deep dive into specific queries
• Visual representation of clicks
• Query-specific optimization
• Result performance patterns

Popular Filter Analytics

Component
Features
Business Value
Filter Analytics Chart
• Bar graph showing filter usage
• Blue bars: Current period usage
• Green bars: Previous period (if comparing)
• Filter key breakdown (color, size, category)
• Visual trend identification
• Quick filter popularity assessment
• Period-over-period comparison
Filter Analytics Table
Columns:
• VALUE: Filter option selected
• USAGE COUNT: Times used
• UNIQUE SEARCHES: Distinct searches
• SUCCESS RATE: % leading to clicks/conversions
• AVG RESULTS: Average results returned
• Detailed filter performance data
• Conversion optimization insights
• Filter effectiveness measurement
Usage Examples
Color filter example:
• Blue: 3 uses, 100% success rate
• Grey: 3 uses, 100% success rate
• Pink: 2 uses, 100% success rate
• Understand filtering behavior
• Optimize filter options
• Add popular missing filters
Access Method
Click on any query row to view filter analytics for that specific search term
• Query-specific filter insights
• Targeted optimization opportunities
• Contextual filter performance

Notes

Category
Details
Data Accuracy
• Real-time or near real-time updates
• Historical data available based on plan
• Export for deeper analysis
Click-through Rate Calculation
• Only counts searches where results were shown
• Does not include no-result searches
• May vary by result count
CVR Tracking
• Requires conversion tracking setup
• May not capture all conversion types
• Check tracking implementation
Query Normalization
• Similar queries may be grouped
• Case-insensitive
• Trimmed whitespace

Best Practices

Daily Review

Review Type
Actions
Purpose
Quick Check
• Sort by searches (descending)
• Review top 10 queries
• Check for any 0% Click-through Rate in top queries
• Identify immediate issues
• Monitor high-impact queries
• Quick health assessment
Red Flags
• High-volume query with 0% Click-through Rate
• Sudden drop in search volume
• New queries appearing frequently
• Urgent optimization needed
• Performance degradation alert
• User behavior changes

Weekly Analysis

Analysis Type
Steps
Outcome
Deep Dive
1. Export top 50 queries
2. Categorize by intent (product, category, brand)
3. Calculate average Click-through Rate by category
4. Identify underperforming categories
5. Create optimization plan
• Comprehensive performance overview
• Strategic optimization roadmap
• Category-specific insights
Action Items
• Fix queries with search volume > 10 and Click-through Rate = 0%
• Optimize queries with Click-through Rate < 10%
• Enhance queries with conversions > 0 (maximize ROI)
• Immediate performance fixes
• Progressive improvements
• Revenue optimization

Monthly Strategy

Strategy Component
Activities
Strategic Value
Trend Analysis
• Compare month-over-month
• Identify seasonal patterns
• Track impact of changes
• Measure improvement velocity
• Long-term pattern recognition
• Predictive insights
• ROI measurement
Optimization Priorities
1. Critical: High volume + Low CTR
2. High priority: Medium volume + Zero CTR
3. Medium priority: Low volume + Low CTR
4. Monitor: Improved queries for regression
• Resource allocation guidance
• Impact-based prioritization
• Continuous improvement cycle

Frequently Asked Questions

Question
Answer
Action Required
Why are some queries showing 0% CTR?
Common reasons:
• Results not relevant to query
• Results poorly ranked (good items buried)
• No results returned (see Searches without Results)
• Query misspelled (add synonym)
• Technical issue with result display
Click query to see detailed analysis and review results
What's a good CTR for search queries?
Benchmarks:
Product searches: 30-50% CTR
Category searches: 20-40% CTR
Brand searches: 40-60% CTR
General terms: 15-30% CTR
Target depends on query type and industry
How do I improve CTR for specific queries?
Optimization steps:
1. Review results: Are correct items shown?
2. Check ranking: Are best items at top?
3. Add synonyms: Handle variations
4. Use rules: Boost/bury specific items
5. Improve attributes: Better searchable fields
Test changes using comparison mode
Why is my conversion rate 0 for all queries?
Possible causes:
• Conversion tracking not implemented
• Event not firing correctly
• Long conversion window (not captured yet)
• Product/service not suitable for immediate conversion
Verify conversion tracking setup in your integration
Can I see which results were clicked for each query?
Yes, if available in your plan:
1. Click on the query row
2. View detailed modal/page
3. See result click distribution
4. Analyze which items are most clicked
Use this to optimize result ranking
How do I export search data?
1. Apply desired filters (date, tags)
2. Click download icon (↓) in top right
3. Select format (usually CSV)
4. Open in Excel/Sheets for analysis
Export limits may depend on your plan
What's the difference between Searches and Searches Results?
Searches (current page):
• Query-level metrics
• Shows each search term
• Focus on query performance

Searches Results:
• Result-level metrics
• Shows which items were clicked
• Focus on individual products/content
Use both together for complete analysis
How often should I review search data?
Recommended:
Daily: Top 10 queries, spot check CTR
Weekly: Full analysis, prioritize fixes
Monthly: Trend analysis, strategic planning
After changes: Validate improvements using comparison mode
Follow recommended schedule for optimal results