SEARCHES RESULTS
Overview
Searches Results provides detailed analytics for individual products/items that appear in search results. Track which results get clicked, their impressions, revenue generated, click-through rate, and conversions. Use this data to optimize product visibility and ranking.
This complements the Searches page which focuses on query-level metrics.
Filter Options
For detailed information about analytics tags and filtering functionality, see Overview - Filter Options.
Results Table
Table Header
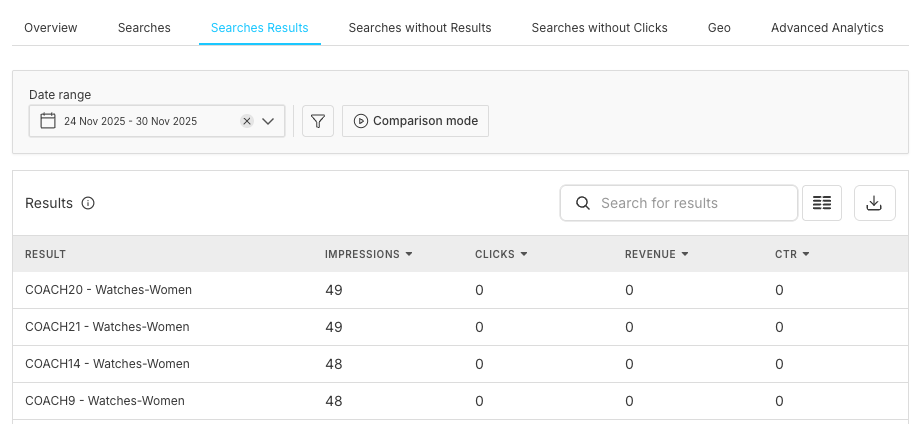
Title: Results
Table Columns
Result Details Modal
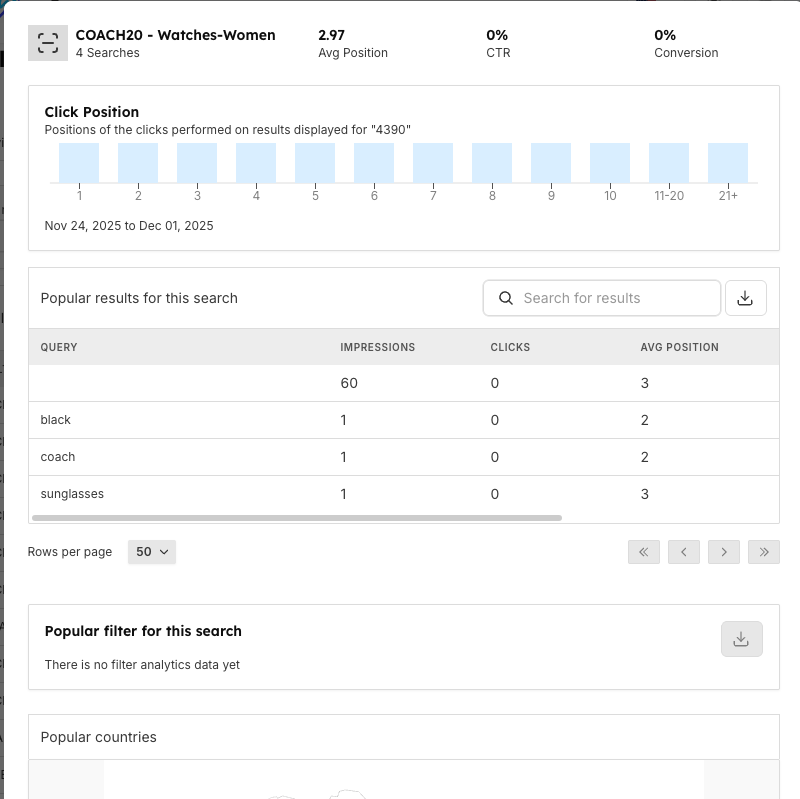
Opening Details
Action: Click on any result row
Result: Modal dialog opens with detailed analytics
Modal Header
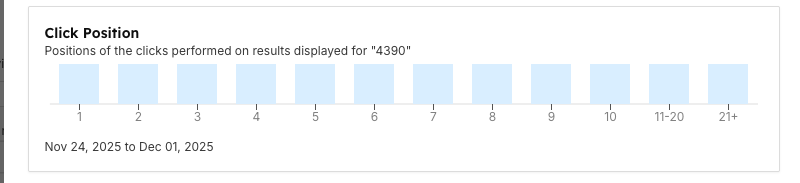
Click Position
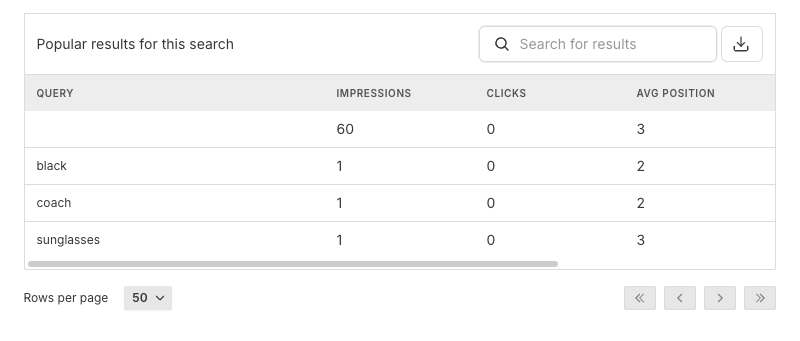
Popular Results for This Search
Popular Filter for This Search
Title: Popular filter for this search
Purpose: Shows which filters users apply when viewing this result
When available:
- Filter types (color, size, price range, etc.)
- Usage frequency
- Success rates
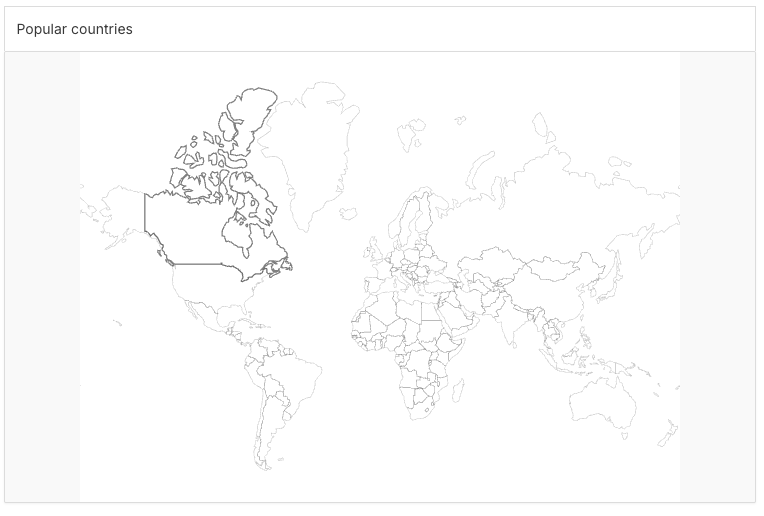
Popular Countries
Understanding the Data
Working with Results Data
Optimization Workflow
Revenue Optimization
Using Filters
Important Notes
Best Practices
Daily Monitoring
Weekly Analysis
Product Data Optimization
A/B Testing Results
Frequently Asked Questions
Related Features
- Searches: Query-level analytics and search term performance metrics
- Overview: High-level dashboard with key performance indicators
- Searches without Results: Identify and fix queries returning zero results
- Searches without Clicks: Analyze searches that got results but no engagement
- Rules Management: Create custom rules to boost, bury, or modify search results for specific products
- Store Browse: Test and validate search result optimizations in real-time
- Query Suggestions: Guide user searches with autocomplete and suggestions
- User Management: Control access to analytics data based on roles
- Activity Logs: Track all changes made to search configuration and product rules