ANALYTICS
Overview
Seekora's Analyatic provides a comprehensive dashboard to monitor search performance, user engagement, and query patterns. Track key metrics like total users, searches, conversion rates, and identify trends to optimize your search experience. Use insights from these Key Metrics Cards to improve your search configuration and rules management.
Date Range Selector
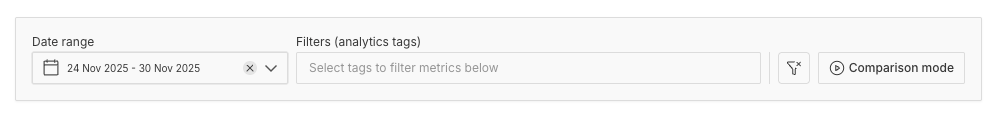
- Click date range to open calendar
- ✕ button: Clear selection
- Custom range selection available
- Tip: Use different date ranges to analyze patterns in Top Searches and No Results queries
Filter Options
: Opens filter dropdown
Available Filters (analytics tags):
Filter analytics by specific search types or sources. Available tags may include:
{
  "search_types": [
    "paid_search",
    "organic_search",
    "search_ui_v2",
    "search_autocomplete_v3",
    "voice_search"
  ],
  "campaign_tags": [
    "research_mode",
    "visual_search",
    "back_to_school",
    "new_arrivals",
    "email_newsletter",
    "recommendation_engine_a"
  ],
  "custom_tags": "Other custom tags based on your configuration"
}
Comparison Mode
Purpose: Compare current period with previous period or custom date range
Use with: Key Metrics Cards to identify trends and measure impact of optimization efforts
Key Metrics Cards
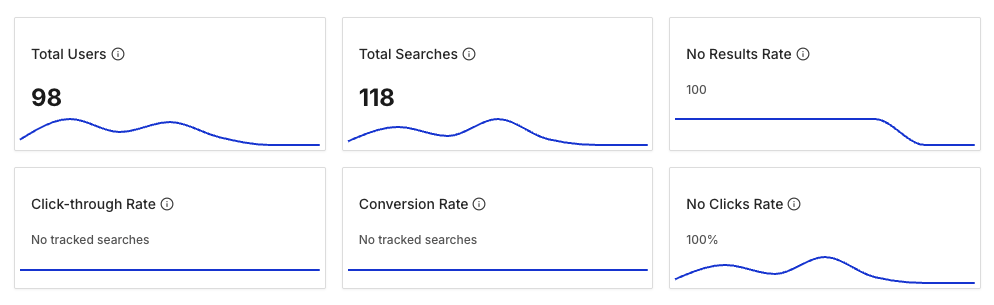
Six primary metric cards display high-level statistics with mini trend graphs:
Trends Overview Graph
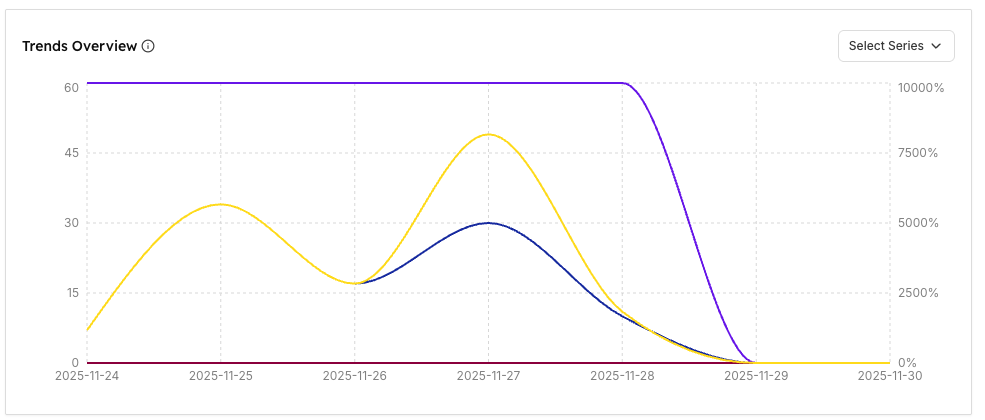
Title: Trends Overview
Quick Start: Jump to Understanding the Graph for interpretation tips
Understanding the Graph
Bottom Section Tables
Three side-by-side tables provide detailed breakdowns:
1. Top Searches
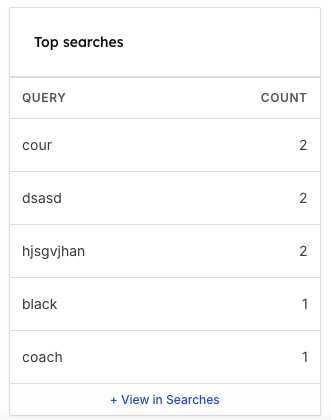
Displays: Most frequently searched queries during selected date range
Action Link: + View in Searches (redirects to detailed searches page)
Use:
- Identify popular products/topics
- Optimize content for high-demand queries (test with Store Browse)
- Plan inventory or content strategy
- Understand user intent and interests
- Deep dive: Use detailed Searches Analytics for comprehensive query analysis
2. Top Results
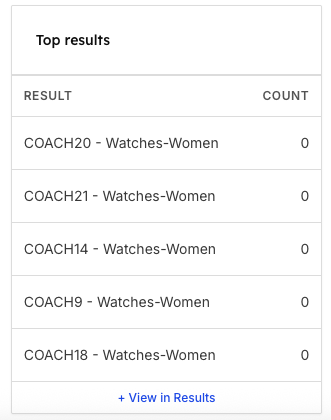
Displays: Most frequently displayed items/results across all searches
Action Link: + View in Results
Use:
- Identify most-shown products/content
- Verify result quality and relevance
- Optimize product visibility
- Understand what content appears most often
3. Searches without Results
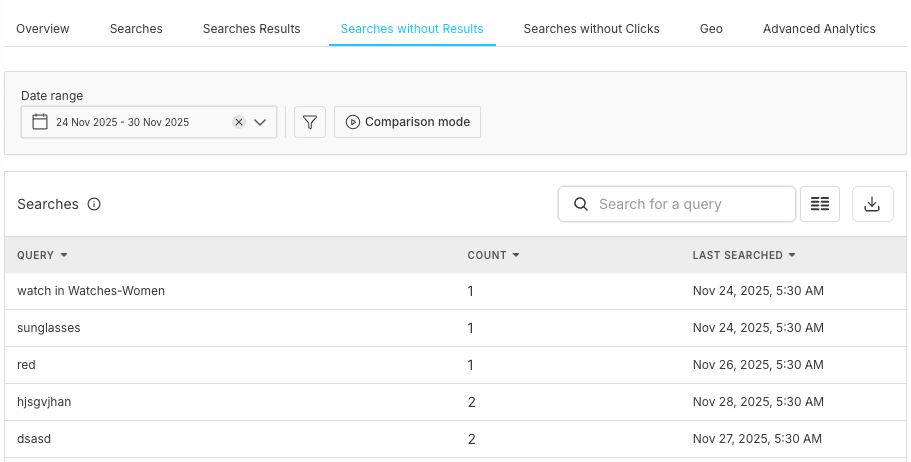
Displays: Queries that failed to return any results, sorted by frequency
Action Link: + View in No Results (opens detailed no-results page)
Critical Insight:
- These are missed opportunities
- High-count queries need immediate attention
- Add missing content or improve query understanding
- Prioritize based on frequency
- Solutions: Create declensions groups for word variations, add synonyms, or create rules for query handling
Notes
Best Practices
Daily Review
Weekly Analysis
Frequently Asked Questions (FAqs)
Related Features
Detailed Analytics:
- Searches: Deep dive into query patterns and trends
- Searches Results: Analyze which results perform best
- Searches without Results: Identify and fix content gaps
- Geo Analytics: Location-based search patterns
Search Optimization:
- Query Suggestions: Guide users with intelligent suggestions
- Rules Management: Create targeted search optimizations
- Declensions: Handle word variations and plurals
- Store Configuration: Fine-tune search behavior and relevance
Store Management:
- Browse Interface: Where users experience your search optimizations
- Store Statistics: Technical performance metrics