Usage Details
Overview
Usage Details offers a detailed view of how your account consumes Seekora features. It highlights usage trends, patterns, and resource activity so you can optimize performance and control costs. Manage your stores via Store Configuration and monitor team access through User Management.
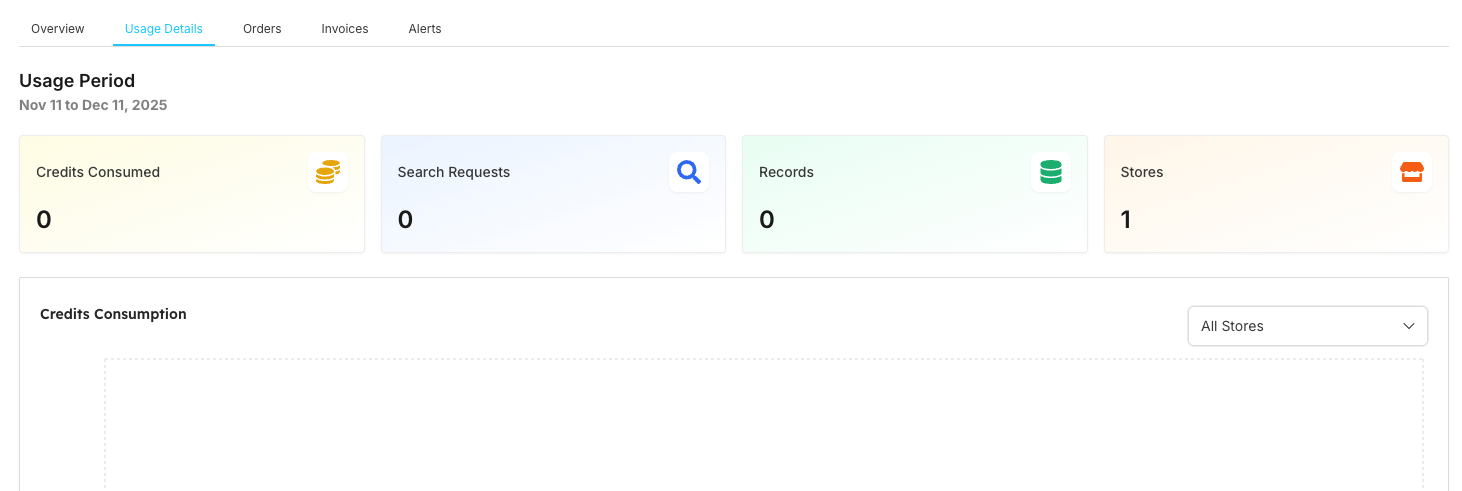
Usage Period Management & Usage Metrics Dashboard
Time Period Selection & Key Performance Indicators
Monitor usage for specific time periods and track essential usage metrics:
| Category | Setting/Metric | Description | Use Case/Impact |
|---|---|---|---|
| Time Period | Usage Period | Selected date range for analysis | Nov 11 to Dec 11, 2025 |
| Usage Metrics | Credits Consumed (0) | Total credits used in period | Direct cost impact |
| Usage Metrics | Search Requests (0) | Number of search API calls made (correlate with Analytics data) | Core service usage |
| Usage Metrics | Records (0) | Data records processed | Storage utilization |
| Usage Metrics | Stores (1) | Active store count | Account structure |
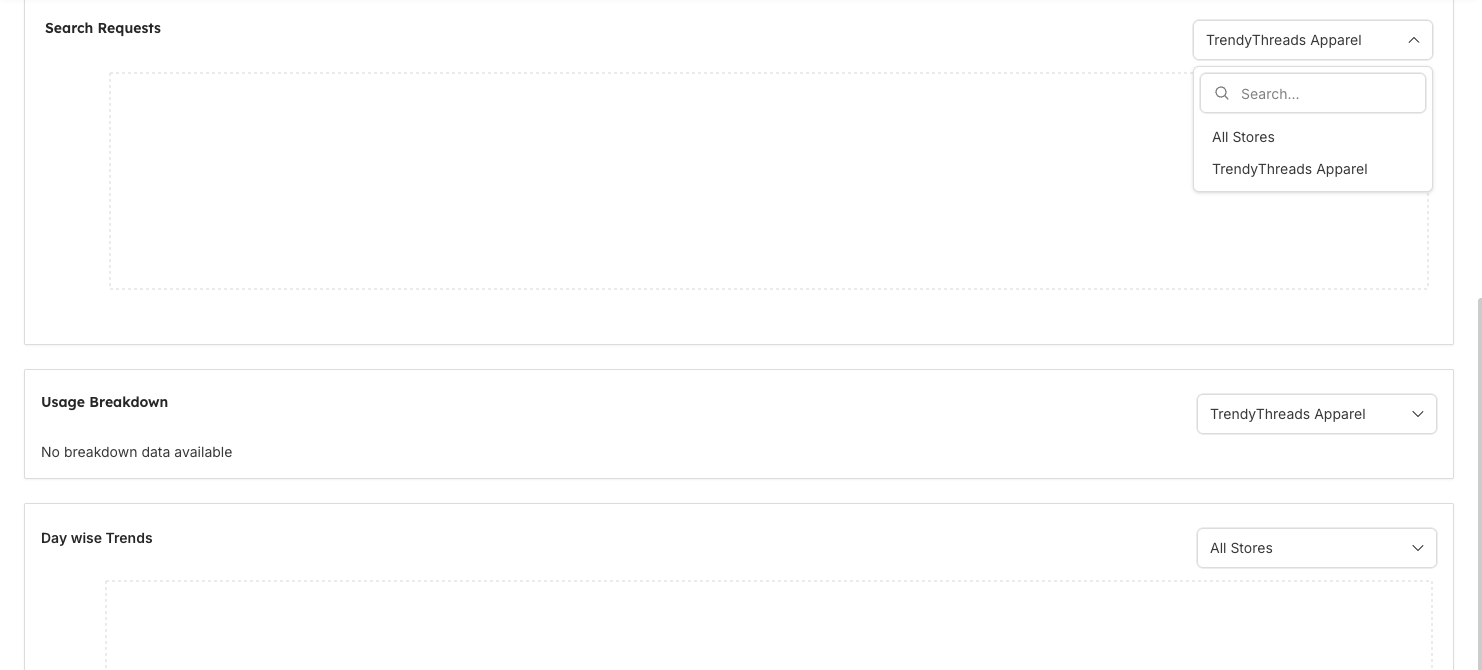
Store-Based Usage Filtering
Store Selection & Usage Analytics
Filter usage data by specific stores and monitor detailed analytics. See Dashboard Components for visual representation of these metrics:
| Category | Filter/Metric | Description | Purpose |
|---|---|---|---|
| Store Selection | TrendyThreads Apparel | Current active store for analysis (manage stores in Store Browse) | Store filtering |
| Analytics Section | Credits Consumption | Track credit usage over time (set up alerts via Notifications) | Cost monitoring |
| Analytics Section | Search Requests | Monitor API request volume | Usage tracking |
| Analytics Section | Usage Breakdown | No breakdown data available | Detailed analysis |
| Analytics Section | Day wise Trends | Daily usage pattern analysis | Trend monitoring |
Dashboard Components
Visual Indicators
The Usage Details dashboard provides comprehensive usage monitoring capabilities:
| Component | Feature | Description | Current Value |
|---|---|---|---|
| Period Selector | Usage Period | Date range selection for analysis | Nov 11 to Dec 11, 2025 |
| Usage Metrics | Credits Consumed | Total credits used with coin icon | 0 |
| Usage Metrics | Search Requests | API calls made with search icon | 0 |
| Usage Metrics | Records | Data records with database icon | 0 |
| Usage Metrics | Stores | Active stores with store icon | 1 |
| Store Filter | Store Selection | Dropdown for store filtering | TrendyThreads Apparel |
| Analytics Charts | Credits Consumption | Graph showing API request patterns (correlate with Searches Analytics) | No data |
| Analytics Charts | Search Requests | Graph showing API request patterns (compare with Searches Analytics) | No data |
| Analytics Charts | Usage Breakdown | Detailed usage analysis section | No breakdown data available |
| Analytics Charts | Day-wise Trends | Daily usage pattern analysis | All Stores |
Data Status
Current dashboard status and availability:
| Status Category | Feature | Current Status Description | Status |
|---|---|---|---|
| Data Availability | Usage Data | No active usage data for the selected period | Empty |
| Metric Status | Metric Values | All metrics showing zero values | Zero |
| Filter Status | Store Filtering | Available for TrendyThreads Apparel store | Active |
| System Status | Analytics Readiness | Sections ready for data visualization when usage occurs | Ready |
Related Features
Store Management
- Store Configuration: Configure and manage your stores
- Store Browse: Browse and manage store data and settings
Analytics & Monitoring
- Analytics Overview: Correlate usage data with search performance metrics
- Geo Analytics: Geographic usage patterns and regional performance
- Activity Logs: Track usage pattern changes and system activity
- Notifications: Set up alerts for usage thresholds and billing notifications
User & Access Management
- User Management: Control team access to billing and usage data
- Roles & User Management: Configure role-based access to usage analytics
- Profile Settings: Manage account settings and billing preferences