API LOGS
Overview
API Logs provides real-time monitoring of all API requests made to your store. Track request URLs, methods, response codes, and timestamps to debug issues, monitor performance, and understand API usage patterns. Configure monitoring settings in Configuration and analyze long-term trends in Analytics.
Why Use API Logs?
API Logs help you:
- Debug issues - Identify failed requests and error patterns (see Debugging Workflows)
- Monitor activity - Track all API calls in real-time (learn about Real-time Monitoring)
- Analyze usage - Understand which endpoints are most used (detailed analysis in Analytics)
- Performance tracking - Monitor response times and success rates (view Performance Monitoring )
- Security auditing - Review API access patterns (manage access in User Management)
Real-World Example: If users report search issues, check API Logs to see if search requests are failing, which endpoints are being called, and what error codes are returned. Then use Browse to test searches and verify results. Compare actual search behavior with Configuration settings and analyze patterns in Analytics.
Page Controls
Pause Button
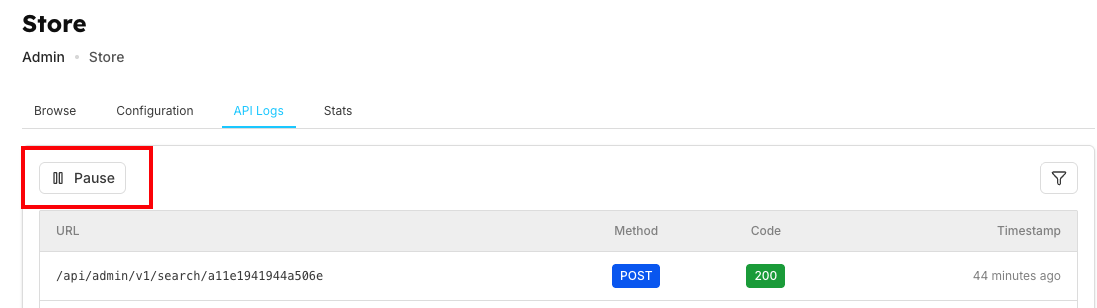
Purpose: Pause/Resume real-time log updates
Use Cases and States:
| Use Case | Purpose | State | Description |
|---|---|---|---|
| Resume to continue monitoring | Real-time log updates (see Real-time Monitoring) | Active (logging) | Logs update in real-time as requests come in |
| Pause to analyze specific logs | Without new entries interfering | Paused | Logs freeze at current state, new requests not displayed |
Filter Button
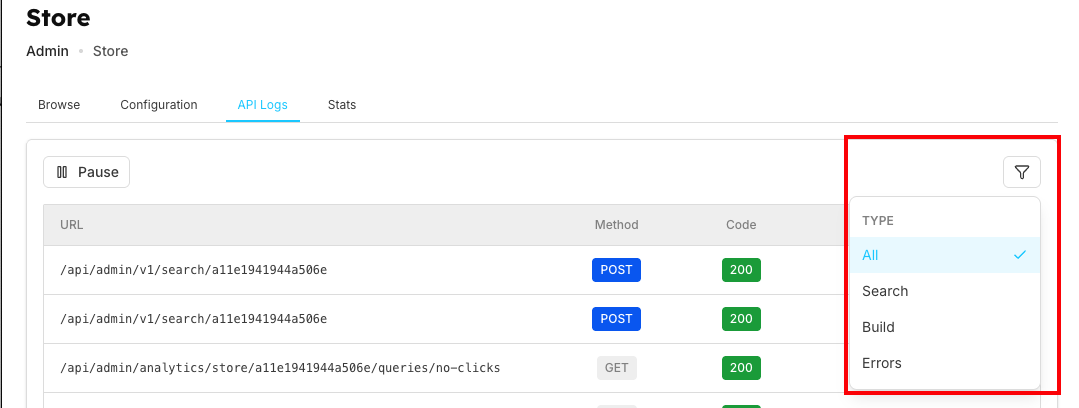
Filter Options and Button Details:
| Filter Option | Option Description | Button Details |
|---|---|---|
| All | Show all request types (default) | Location: Top right of logs table |
| Search | Only search-related API calls | Icon: |
| Build | Index build and update operations (configure in Configuration) | Purpose: Filter logs by type |
| Errors | Failed requests only | Shows: 4xx and 5xx status codes |
API Logs Table
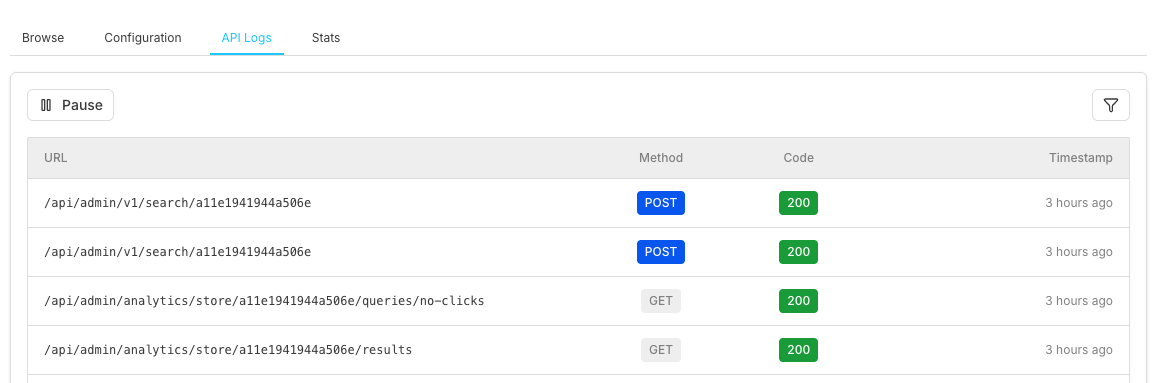
Table Columns
| Column | Description | Examples & Details |
|---|---|---|
| URL | Full API endpoint path with store ID and version | /api/admin/v1/search/{storeId}Shows: endpoint, store ID (manage in Store Management), API version (v1) |
| Method | HTTP request method with color-coded badges | POST GET PUT DELETE |
| Code | HTTP response status code with color indication | 200 400 500 Green: Success, Yellow: Client errors, Red: Server errors |
| Timestamp | Relative time when request was made | "Just now", "2 minutes ago", "5 minutes ago" Updates: Real-time when not paused |
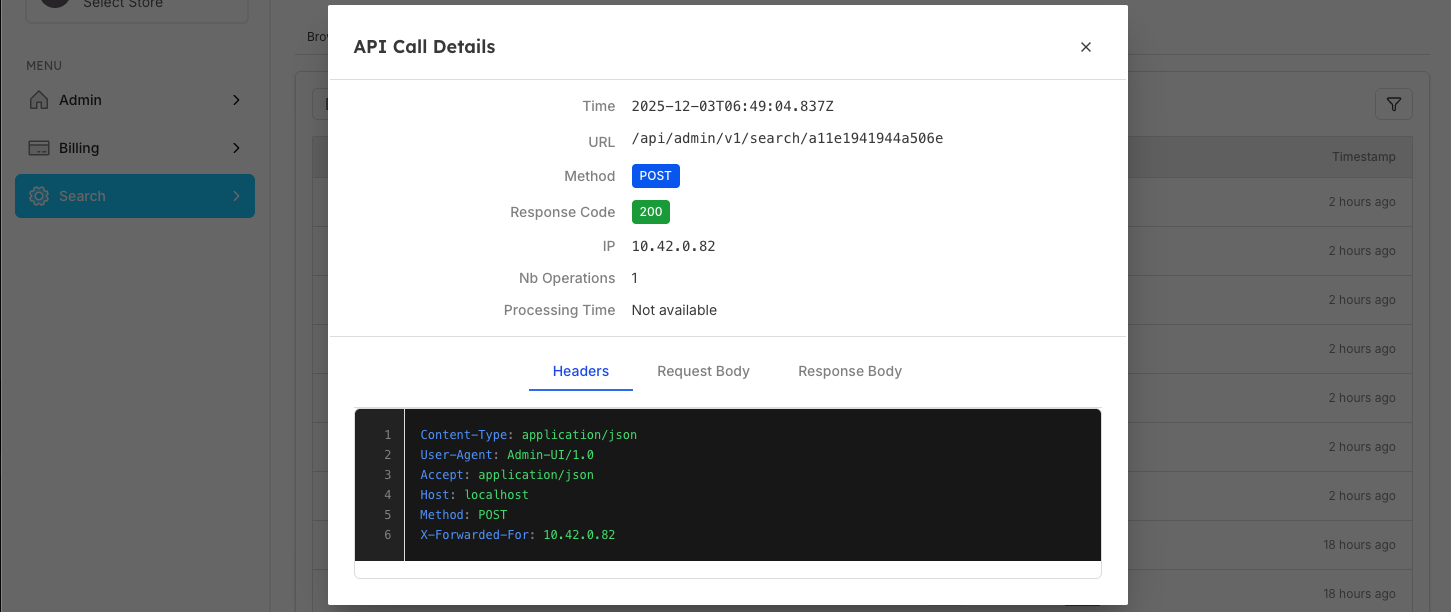
API Call Details
Opening Details
| Action | Result |
|---|---|
| Click on any API log entry row | Modal dialog opens showing complete request information with detailed tabs for headers, request body, and response data |
Request Information
The dialog displays detailed information about the selected API call:
| Field | Description | Example & Details |
|---|---|---|
| Time | Full timestamp with millisecond precision | ISO 8601 format (UTC timezone)Shows exact request time |
| URL | Complete API endpoint path | /api/admin/v1/search/{storeId}Shows: Full path, store ID, API version, endpoint type |
| Method | HTTP request method with colored badge | POST GET PUT DELETE |
| Response Code | HTTP status code with colored badge | 200Success responses Color coded: 2xx, 4xx, 5xx |
| IP | IP address of the request origin | 10.42.0.82Use cases: Identify source, debug issues, security monitoring |
Request Details Tabs
The dialog provides three tabs for detailed inspection:
1. Headers Tab

Purpose: View HTTP request headers
| Displays | Common Headers | Use Cases |
|---|---|---|
• Line-numbered code view |
| • Verify content type |
2. Request Body Tab
Purpose: View the request payload/data sent
Display: JSON formatted with syntax highlighting
Example content:
{
  "query": "black women watches",
  "filters": {
    "brandName": ["coach", "alexandre christie"],
    "category": ["Watches-Women"],
    "color": ["black"],
    "priceRange": {
      "min": 100,
      "max": 500
    }
  },
  "limit": 20,
  "offset": 0,
  "sortBy": "relevance",
  "facets": ["brandName", "category", "color", "price"]
}
Use cases:
- Verify search queries
- Check filter parameters
- Debug data format issues
- Analyze request structure and troubleshoot issues
Note: Empty for GET requests (no body)
3. Response Body Tab
Purpose: View the API response data
Display: JSON formatted with syntax highlighting
Example content:
{
  "hits": [
    {
      "id": "watch_001",
      "brandName": "coach",
      "category": "Watches-Women",
      "color": "black",
      "price": 299.99,
      "title": "Coach Women's Black Leather Watch",
      "imageUrl": "https://example.com/watch1.jpg",
      "inStock": true
    },
  ],
  "totalHits": 42,
  "processingTime": 15,
  "facets": {
    "brandName": {
      "coach": 18,
      "alexandre christie": 24
    },
    "color": {
      "black": 42
    },
    "category": {
      "Watches-Women": 42
    }
  },
  "pagination": {
    "limit": 20,
    "offset": 0,
    "hasMore": true
  }
}
Use cases:
- Verify response structure against expected format
- Check returned data
- Debug empty results
- Analyze response format and performance metrics
Working with API Logs
Monitoring Real-Time Activity
| Step 1: Ensure logs are not paused | Step 2: Watch for patterns | Step 3: Use filters to focus |
|---|---|---|
• Check pause button is not active | • High frequency of same endpoint | • Select "Search" to see only search activity |
Debugging Issues
| Identify Failed Requests | Analyze Patterns |
|---|---|
| • Same endpoint failing repeatedly across multiple requests? |
Common Error Investigation:
| 400 Bad Request | 401 Unauthorized | 404 Not Found | 500 Server Error |
|---|---|---|---|
• Check request parameters against | • Check authentication tokens | • Verify store ID is correct • Ensure resource exists and is properly configured | • Note exact timestamp |
Performance Monitoring
| Track Request Volume | Response Time Analysis |
|---|---|
• Monitor how many requests per minute • Spot unusual spikes in traffic patterns and analyze their cause | • Most requests should be "Just now" |
Notes
| Real-time Updates | Data Retention | Performance Impact | Privacy and Security |
|---|---|---|---|
• Logs stream continuously when not paused | • Logs shown are from current session | • High traffic stores may have rapid log updates | • Logs may contain sensitive information |
Using Filters Effectively
| Troubleshooting Search Issues | Monitoring Index Operations | Security Auditing |
|---|---|---|
• Filter by "Search" to isolate search-related requests | • Filter by "Build" to monitor index operations | • Review all request types for comprehensive monitoring |
Pause Strategy
| When to Pause | When to Resume |
|---|---|
• Investigating a specific error in detail: Click on the failing request to open modal, examine headers tab for authentication issues, review request body for malformed data, analyze response body for error messages, note exact timestamp and IP address, check if error is isolated or part of pattern | • After investigation is complete and documented |
Frequently Asked Questions (FAQs)
How long are logs retained?
Logs shown in the API Logs tab are typically from the current session. For historical analysis, use the Stats tab which provides date-range filtering and performance graphs. Configure retention settings in Configuration.
Why don't I see any logs?
Possible reasons:
- No API activity currently happening (test with Browse)
- Logs are paused (check pause button)
- Filter is set to specific type with no matching requests (check filter options)
- Permission issues (verify access rights in User Management)
What does "Just now" mean exactly?
"Just now" indicates the request occurred within the last minute. Timestamps become more specific (e.g., "2 minutes ago") as time passes.
Can I see request/response bodies?
The basic API Logs view shows URL, method, code, and timestamp. For detailed request/response data, click on any log entry to see Request Details Tabs including headers, request body, and response body. Configure enhanced logging in Configuration.
How do I identify slow requests?
While timestamps show when requests occurred, for detailed response time analysis, use the Stats tab which provides performance metrics and graphs. You can also optimize slow queries in Configuration.
What should I do if I see many errors?
- Use filter to isolate "Errors" only
- Note the affected endpoints
- Check if it's a specific endpoint or widespread
- Review error codes for diagnosis (see Error Investigation)
- Test fixes using Browse to verify resolution
- Adjust settings in Configuration as needed
Best Practices for API Log Monitoring
-
Regular Monitoring
- Check logs daily for any anomalies using real-time monitoring
- Set up alerts for critical errors in Configuration
- Monitor response times during peak hours with Analytics
-
Error Investigation
- Always investigate 4xx and 5xx errors using debugging workflows
- Check response times for performance issues via Performance Monitoring
- Verify successful completion of critical operations in Store Management
- Use filter options to isolate specific error types
-
Performance Optimization
- Use log data to optimize search configurations
- Identify and address slow queries in Browse interface
- Monitor API usage patterns with Analytics
-
Data Management
- Regularly review and clean up old logs using filtering options
- Export important log data for compliance (see billing features)
- Use table controls to focus on relevant information
- Configure retention policies in Configuration
Related Features
- Browse: Search interface and user experience testing
- Configuration: Search settings and parameters optimization
- Stats: Analytics and performance metrics analysis
- Store Management: Multi-store operations and switching
- Analytics Overview: Comprehensive performance monitoring
- Query Suggestions: Search enhancement tools
- Billing: Plan features and export capabilities